Introducing ChartZapp!
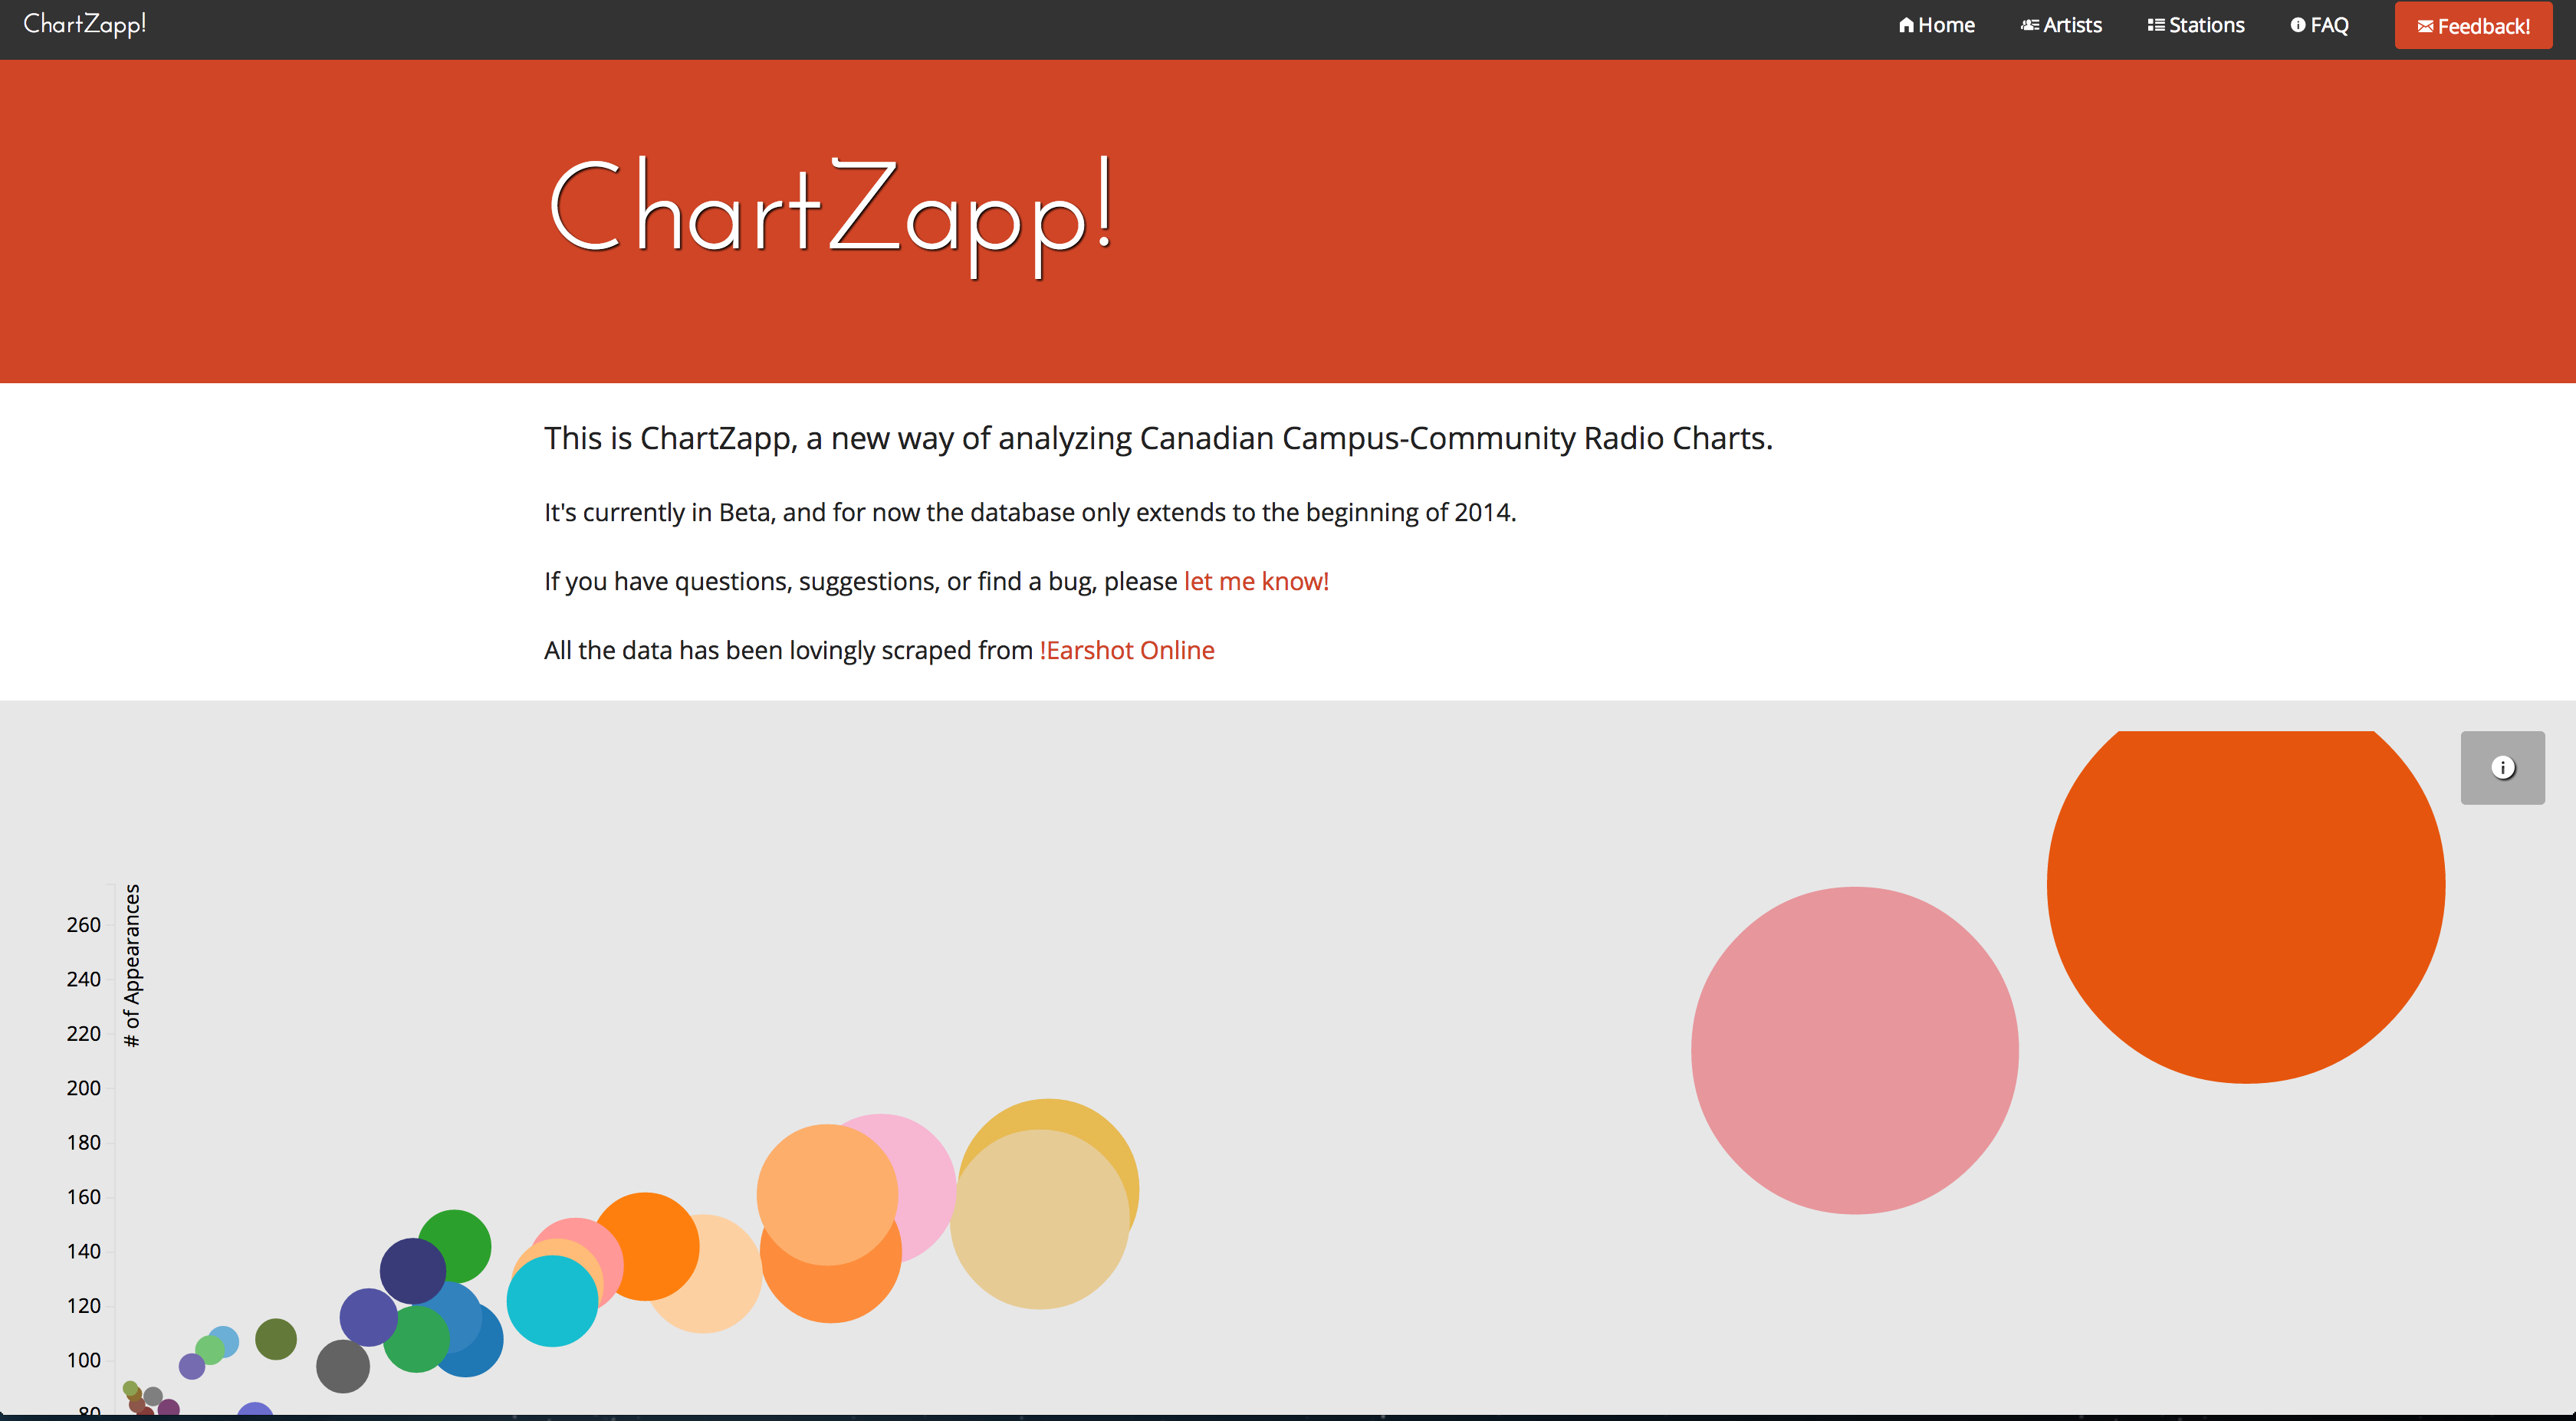
This week, I’m excited to announce the beta release of ChartZapp, a new way to look at Canadian Campus Community Radio Charts.
It’s a project I’ve been tinkering with in my spare time for the past few months, and while I plan to continue it’s development, I figured it was high time to kick it out of the nest, as it were.
Big thanks are due to Farid Rener for the inspiration and encouragement, and to Carol Fraser for dealing with my rather obsessive tendencies.

What’s a ChartZapp!?
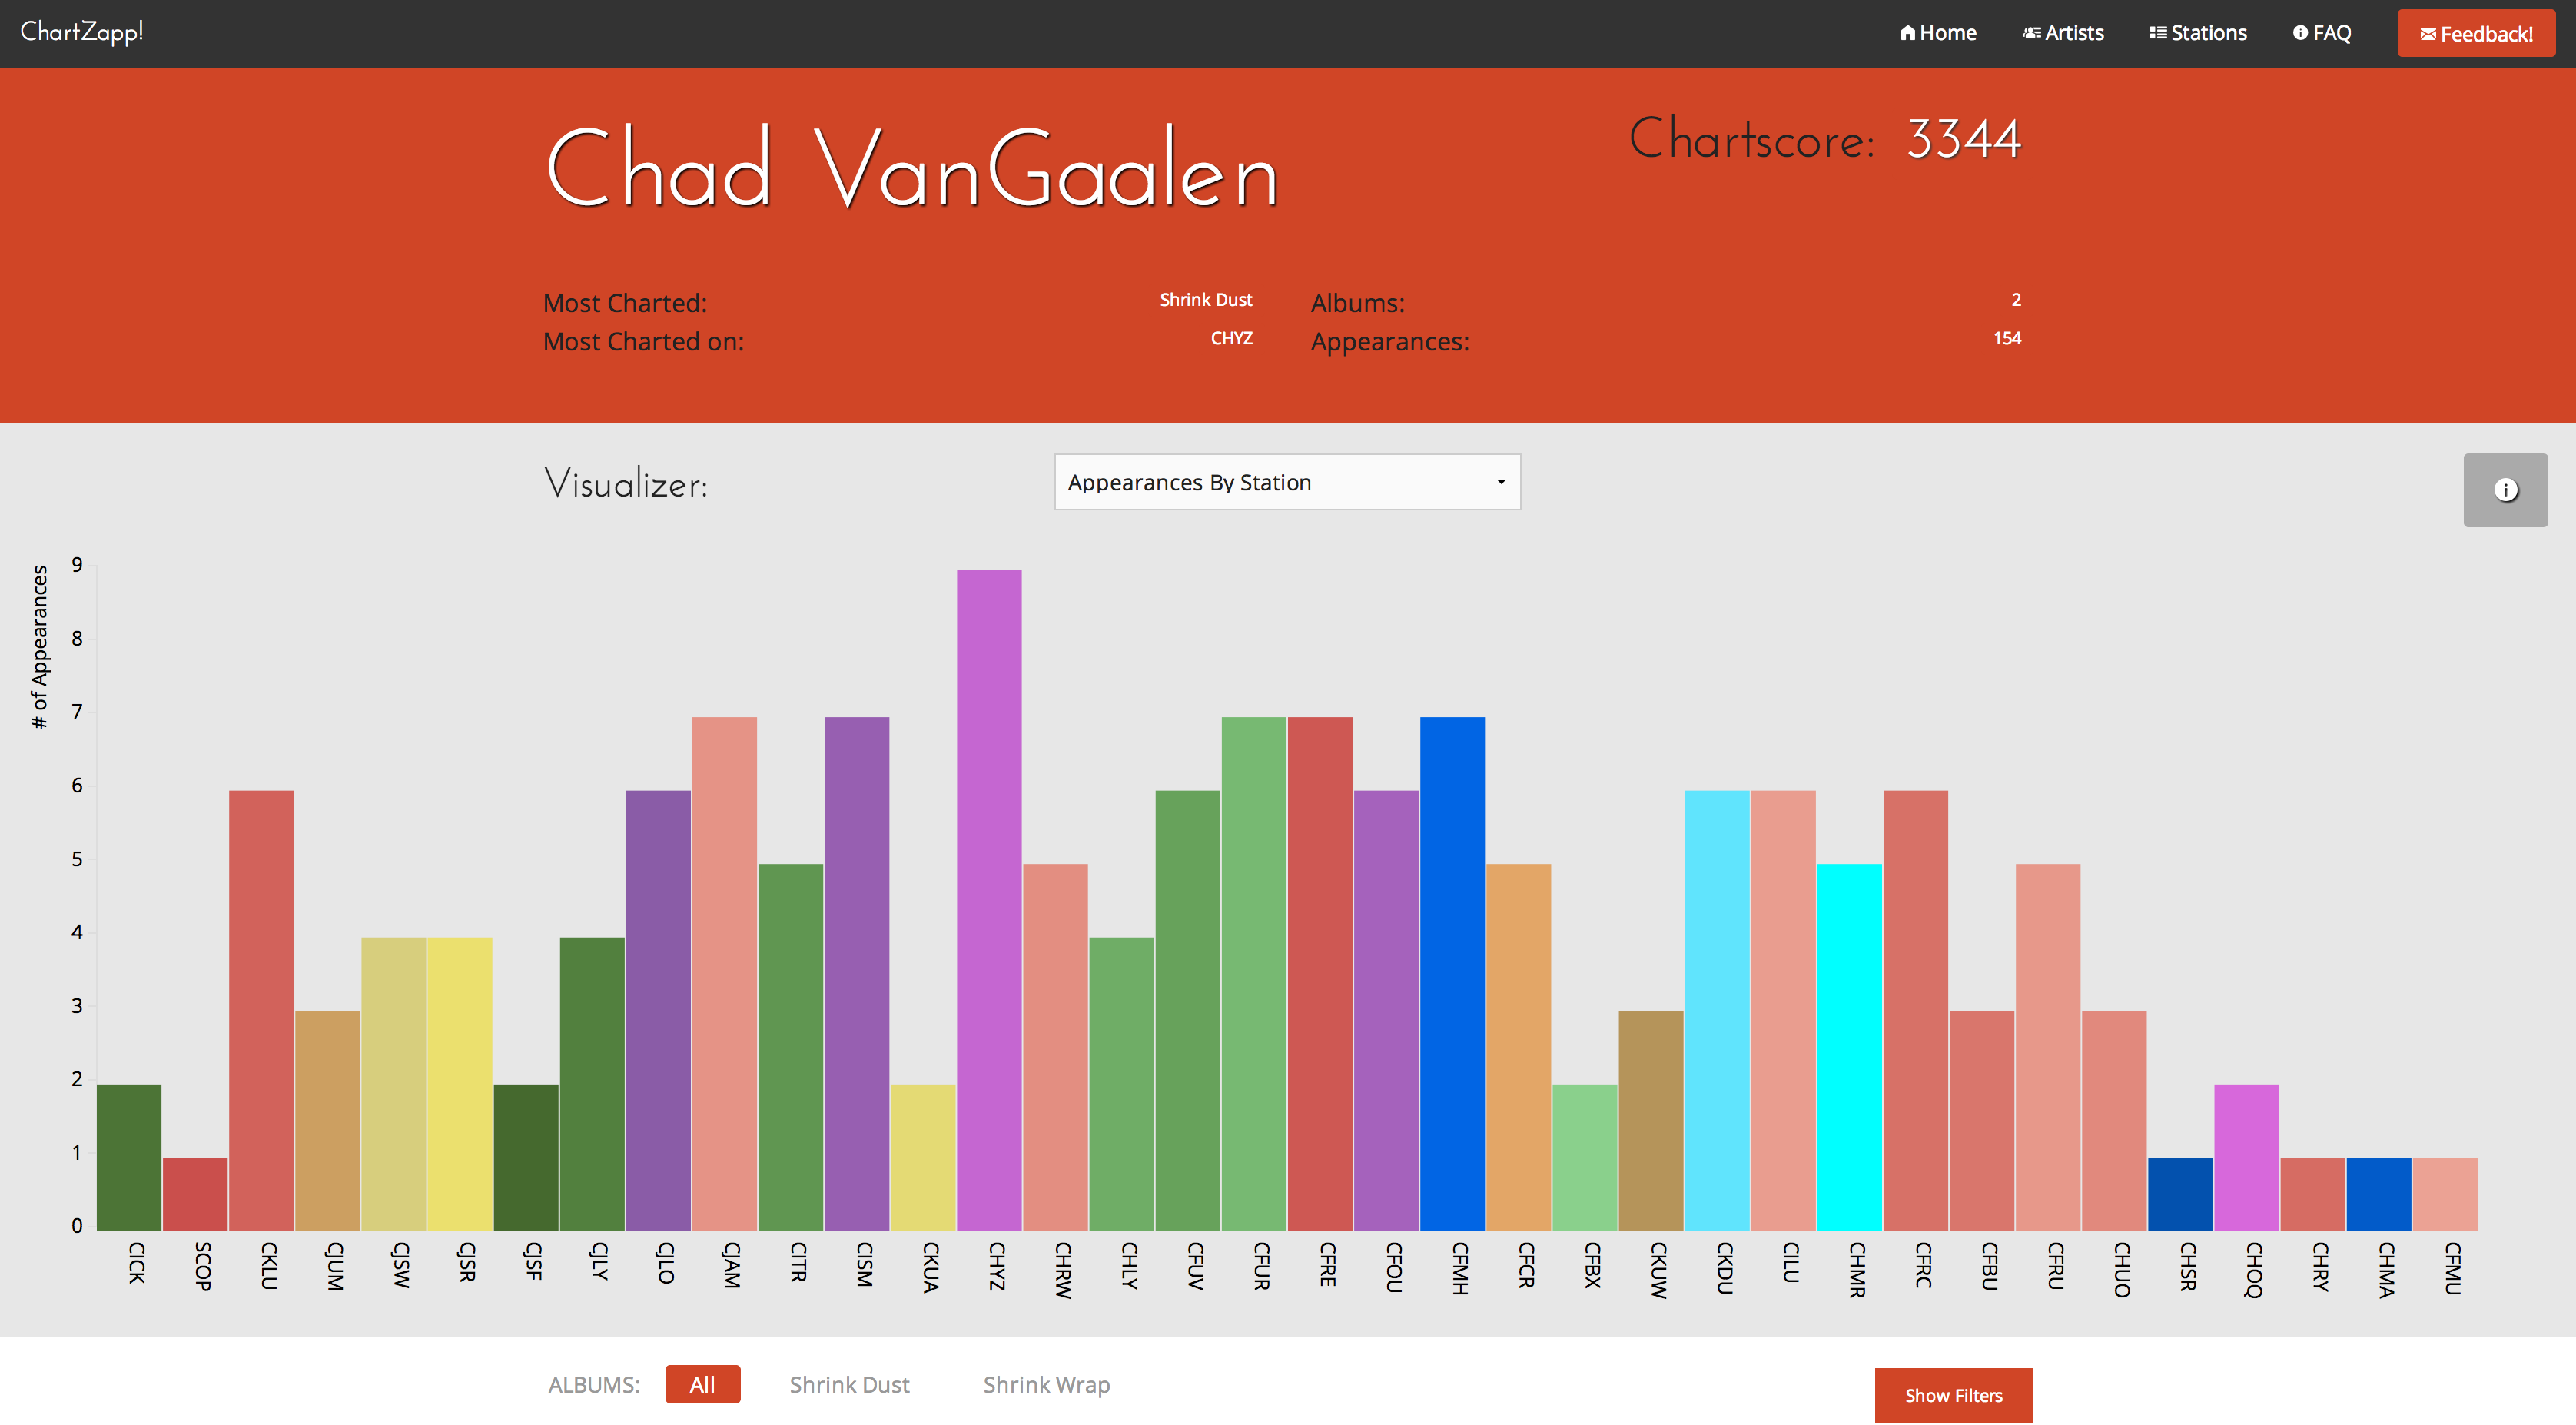
On the surface, it’s a tool to visualize and explore the vast trove of information collected and distributed by Earshot Online.
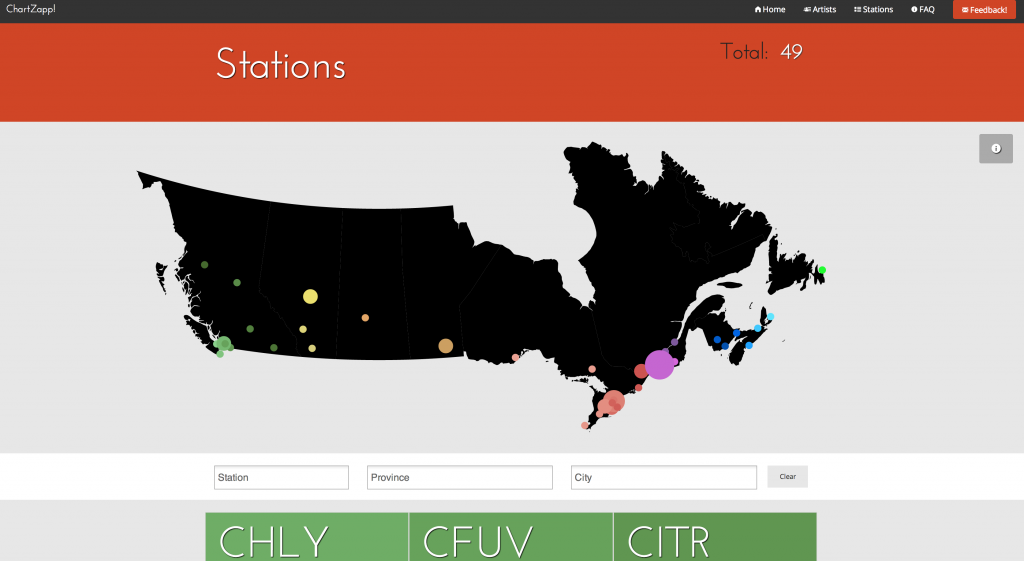
It uses interactive graphs, maps and filters to encourage analysis and discovery of independent music, and campus community radio.
It also aims to make tracking easier for independent artists, labels, and stations.

How’s it work?
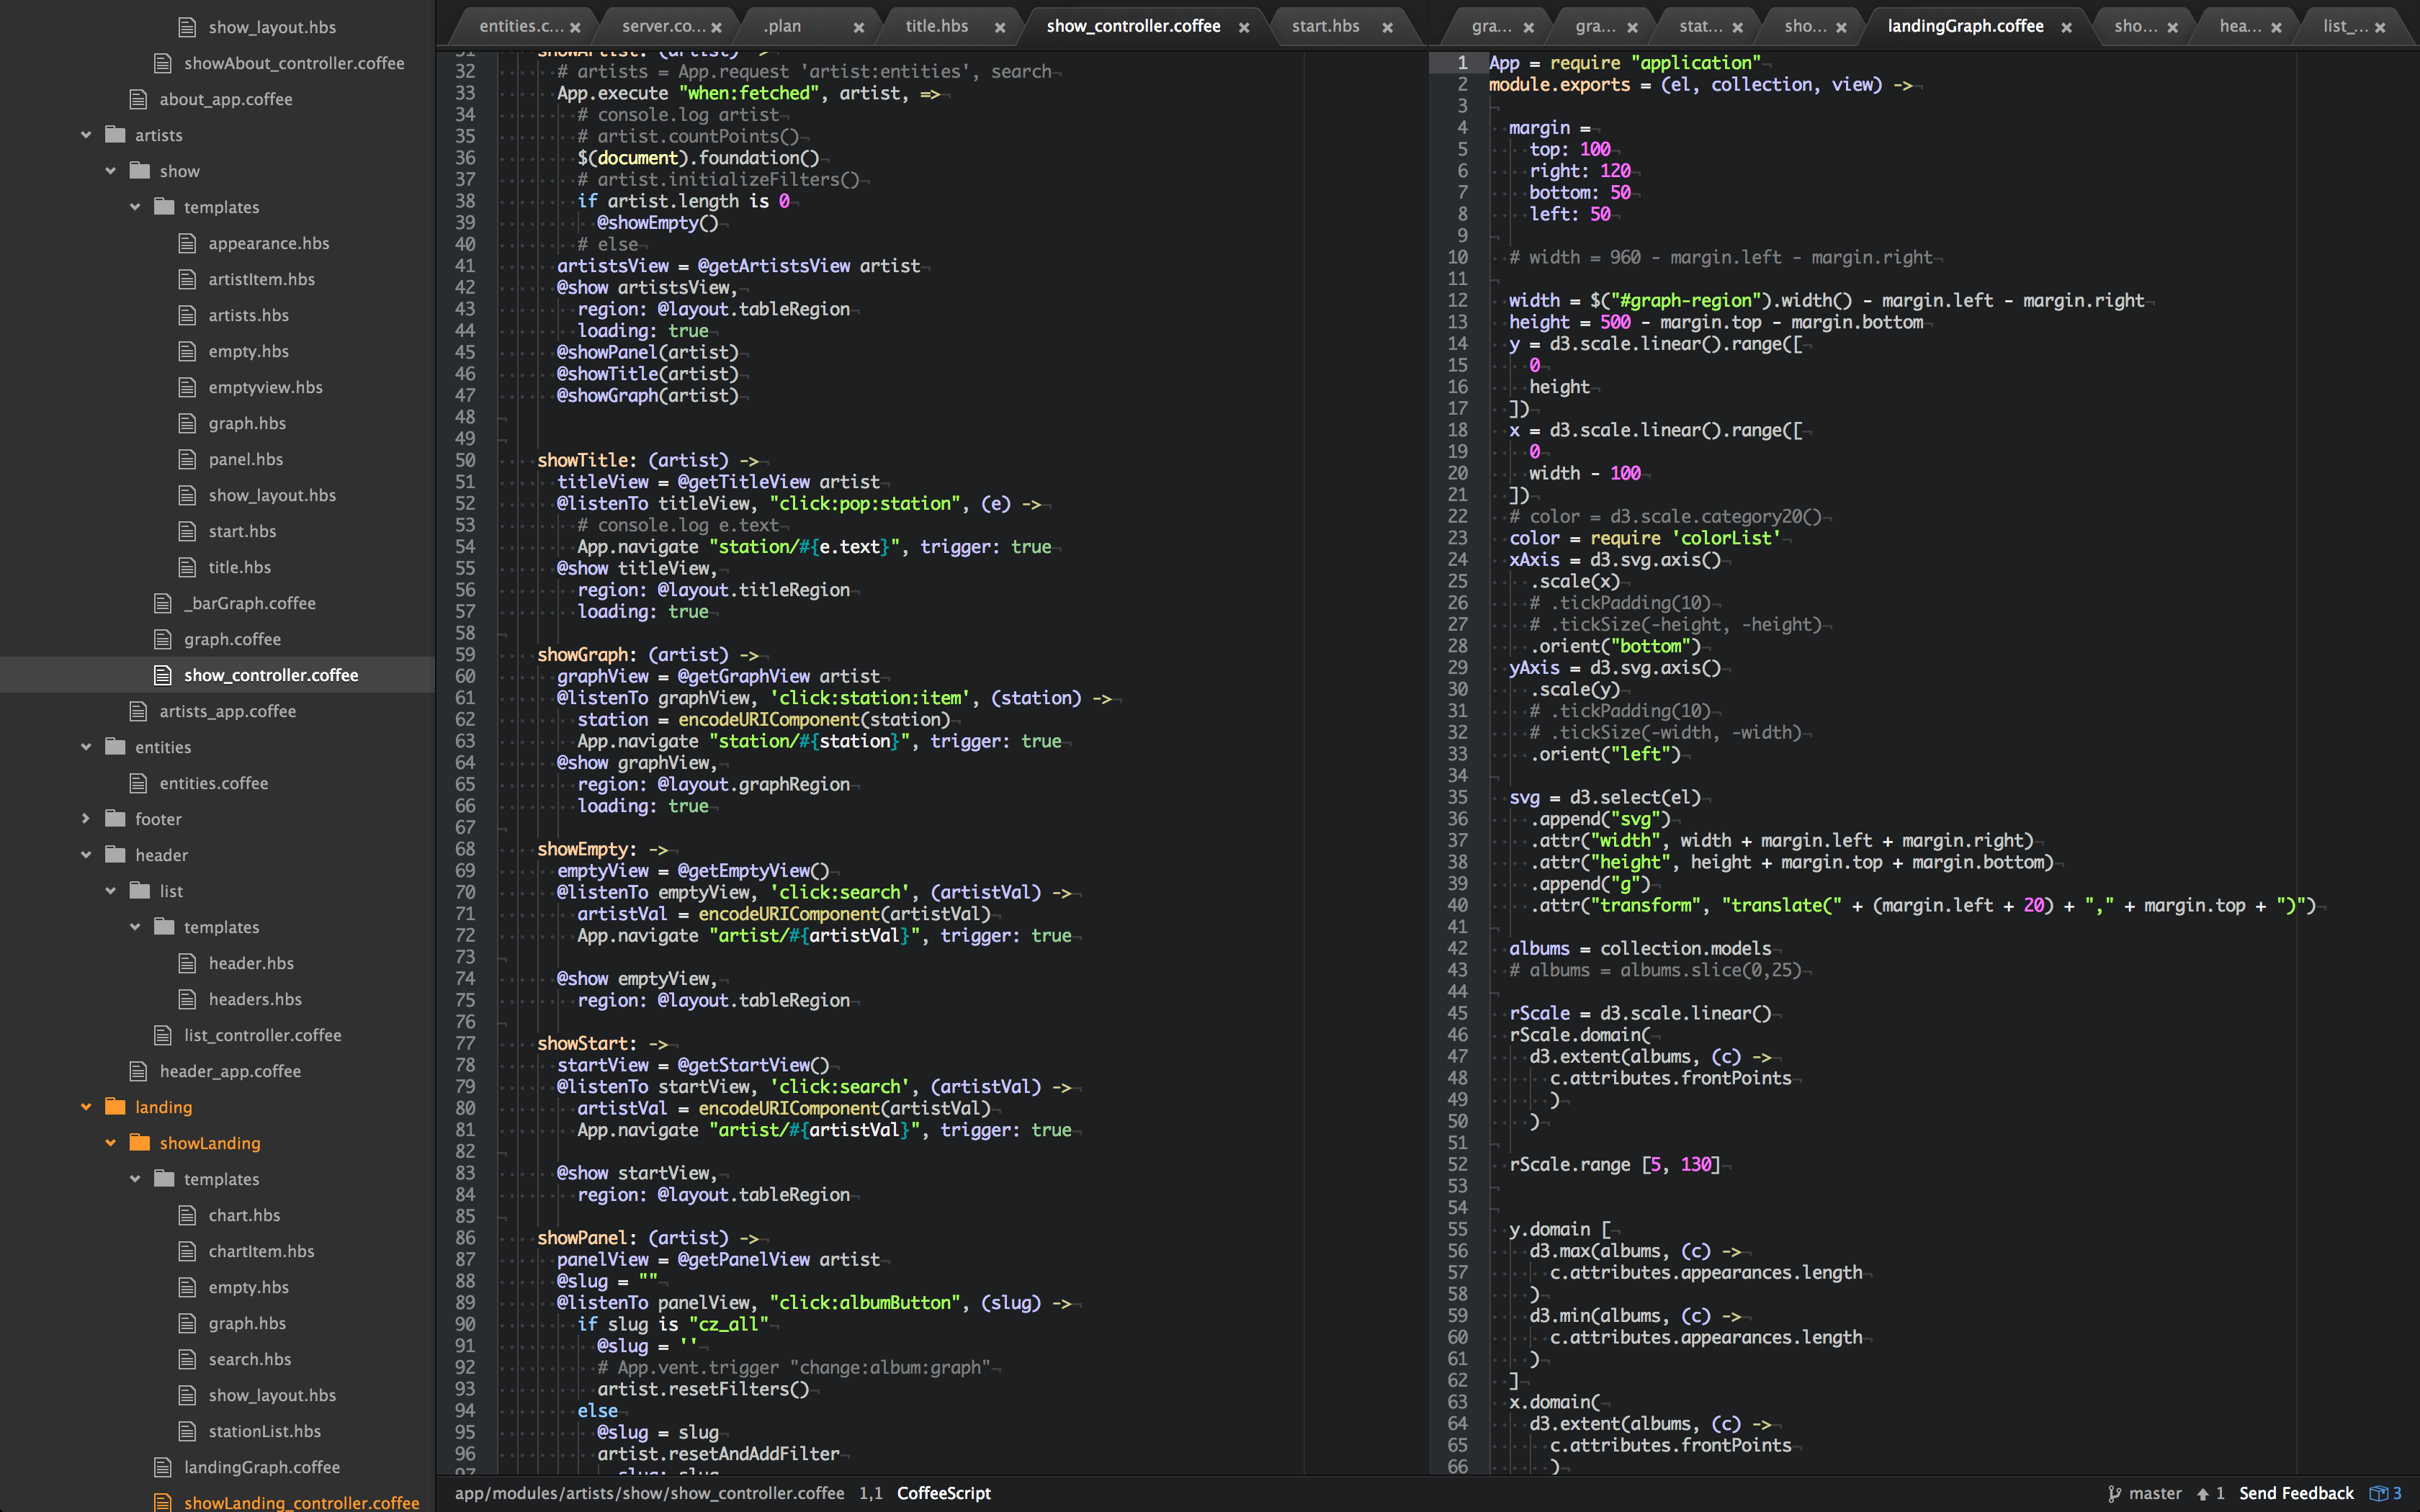
Under the hood, ChartZapp is a Single Page Application, built with the help of a whole ton of open source tools.
It is written almost entirely in Coffeescript on both the front and back-end. It uses Node.js to run a server and webcrawler, which ships data to and from a MongoDB database, and then compares, analyzes and displays things with Backbone, Marionette, and D3. It’s styled with help from the fine folks at Zurb/Foundation.

It is very much a work in progress, and has been a massive learning experience for me. It was my first time building a fully featured application from start to finish, and it was an eye opening and mind bending experience, to be sure.
I’m looking forward to continuing the project, learning more, and improving the codebase and functionality over time.
What’s Next?
In a way, that’s up to you. Right now, I’m monitoring the application’s performance, and listening to feedback from users all across the country.
If you think of an amazing new feature, or something you’d be interested to know more about, there is a Big Red feedback button at the top right of every page!
So, without further ado, I give you: